
When I work with organizations on digital adoption and analytics maturity, I often encounter the same challenge: teams collect vast amounts of user interaction data but struggle to turn those insights into actionable strategies that improve adoption, engagement, and overall business outcomes. Microsoft Clarity provides a unique opportunity in this space. It is a free behavior analytics platform that combines session replay, heatmaps, and AI-driven insights at scale. The challenge is not in accessing the tool but in knowing how to use Microsoft Clarity efficiently to generate meaningful outcomes, particularly in enterprise environments where digital adoption and transformation initiatives demand precision and governance.
In this article, I will provide a comprehensive guide on how professionals can use Microsoft Clarity efficiently. This includes advanced deployment considerations, best practices for analyzing data at scale, integration into broader analytics and adoption strategies, and avoiding common pitfalls. The discussion is aimed at professionals already familiar with analytics fundamentals but looking to elevate their use of Clarity as part of a mature, enterprise-grade digital adoption strategy.

The analytics market includes popular tools like Google Analytics, Hotjar, and FullStory. Each provides insights into user behavior, but Microsoft Clarity differentiates itself by offering unlimited scale at no cost. Google Analytics excels at quantitative metrics such as traffic acquisition and conversion funnels, while Hotjar and FullStory focus on qualitative session replay and heatmaps. Clarity occupies a hybrid position, delivering enterprise-scale qualitative insights while integrating seamlessly into the Microsoft ecosystem.
For enterprises already invested in Microsoft products, this ecosystem alignment is a major advantage. Clarity's ability to feed into tools like Power BI or Azure Monitor means data is not siloed. Instead, organizations can achieve a unified view across systems. This integration makes Clarity especially attractive for digital adoption teams tasked with monitoring employee experience in platforms like Microsoft 365. It creates efficiency by reducing manual reconciliation of insights from different tools and ensuring consistent data governance.
Clarity offers unique features that improve efficiency. Unlike sampling-based systems, Clarity captures nearly all sessions without additional cost. Its AI-powered detection of rage clicks, dead clicks, and excessive scrolling provides automatic prioritization, ensuring analysts spend their time on the most critical friction points.
Clarity also emphasizes privacy, making it compliant with regulations such as GDPR and CCPA. Unlike some competing platforms, Clarity automatically masks sensitive data fields, which reduces compliance risks while still delivering actionable insights. This balance of scale, AI, and compliance makes Clarity particularly valuable for enterprises working across multiple regions and regulatory environments. Beyond compliance, the automation of prioritization means analysts can focus on strategic fixes rather than manual data mining, driving efficiency at scale.
Microsoft Clarity should not be seen as a replacement for quantitative analytics but as a complement. It provides the qualitative context that explains why users act the way they do. For organizations pursuing digital transformation, this is critical. Transformation initiatives fail when adoption lags, and adoption struggles are often rooted in poor user experiences.
Clarity provides the visibility needed to diagnose adoption challenges. When used strategically, it enables enterprises to move from descriptive analytics ("what happened") to diagnostic and prescriptive analytics ("why it happened" and "how to fix it"). This positions Clarity as a key enabler in transformation journeys. It is not just about collecting insights but about feeding those insights into workflows that accelerate adoption. As transformation programs become more data-driven, tools like Clarity serve as the bridge between business goals and digital execution.

Large enterprises often operate dozens of applications, intranets, and customer portals. Deploying Clarity across this ecosystem requires consistency. Central IT teams should define standardized deployment policies, ensuring that Clarity scripts are integrated through Tag managers or centralized governance models. This prevents fragmentation and allows insights to be aggregated.
When every property uses its own approach to tagging and configuration, organizations lose efficiency and insight comparability. Standardization not only ensures data accuracy but also improves governance and compliance oversight. In addition, consistency allows benchmarking across different applications, helping enterprises compare adoption and performance across business units.
SPAs, common in modern JavaScript frameworks, present a challenge because they do not always trigger full-page reloads. If Clarity is not properly configured, key transitions go untracked. Enterprises should use Clarity's API and event tracking features to ensure accurate measurement of virtual pageviews, state changes, and user flows within SPAs.
Without proper configuration, analysts risk underestimating drop-offs or misdiagnosing friction points. This can undermine adoption strategies, particularly in enterprise apps where workflows are complex. Efficient configuration of Clarity ensures complete coverage of user journeys. By investing time in setup, enterprises can save significant effort downstream in analysis and remediation.
Behavioral data can be sensitive. Enterprises must adopt tiered permission structures to limit access to Clarity's session replay. Role-based access ensures that only authorized personnel, such as UX researchers or digital adoption specialists, can view sensitive data. IT and compliance teams should also review replay retention policies to balance insight generation with data protection.
Failure to enforce governance creates risks of compliance violations and breaches of internal trust. By implementing structured governance, organizations maintain control while still empowering analysts. Role-based permissions also streamline accountability by defining who is responsible for which datasets. Governance is therefore both a compliance requirement and an efficiency strategy.
Regulatory compliance is central to efficient deployment. Clarity's default anonymization masks sensitive fields, but organizations should validate this against compliance frameworks like HIPAA for healthcare or SOC 2 for service providers. Clear documentation of data handling policies ensures trust and regulatory alignment.
Privacy compliance also enhances the adoption of analytics internally. Employees and customers are more willing to engage with platforms when they know their data is protected. Enterprises should communicate how Clarity is configured to demonstrate compliance and build trust. By aligning Clarity usage with regulatory standards, organizations both protect themselves and improve data quality by encouraging participation.
Efficiency increases when Clarity is not used in isolation. Exporting Clarity data into Power BI dashboards allows leadership to visualize behavioral trends alongside adoption and performance metrics. Similarly, integration with Azure Data Lake enables advanced analysis and predictive modeling. By centralizing Clarity insights, enterprises accelerate decision-making across departments.
Centralization reduces redundancy by preventing multiple teams from running similar analyses in silos. It also improves governance, as data housed in centralized systems can be more easily secured and audited. Finally, centralization makes Clarity insights more actionable because they are presented alongside other strategic KPIs.

Session replay records each user interaction, creating a play-by-play of digital experiences. This granular visibility highlights frustration points, but without frameworks, the sheer volume of data can overwhelm teams. Understanding how Clarity collects and stores this data is essential for efficient analysis. It captures behaviors such as scrolling, clicking, and navigation to recreate the exact user journey.
This level of detail allows teams to identify usability issues that cannot be detected with quantitative tools alone. For example, while analytics may show that a form has a high abandonment rate, replay can show the exact field where frustration occurs. Efficient use of replay requires both technical understanding and strategic focus. It should not be treated as anecdotal evidence but as structured, analyzable data that supports UX and adoption goals. Over time, organizations that formalize replay analysis frameworks consistently achieve higher ROI from their digital adoption strategies.
Clarity automatically tags sessions with signals such as rage clicks, dead clicks, and excessive scrolling. These AI-powered flags help analysts prioritize which sessions to review first, which is crucial when thousands of replays are available daily. Rather than spending hours sifting through irrelevant sessions, analysts can focus on the interactions most likely to reveal systemic issues. This prioritization ensures that resources are directed toward areas where improvements will deliver the greatest impact.
For example, sessions marked with rage clicks often point to non-responsive buttons or confusing interface patterns. By addressing these high-friction points quickly, organizations can prevent recurring frustration and support faster adoption. In enterprise settings, prioritization at scale is the difference between efficient workflows and wasted analysis cycles. AI-driven triaging transforms replay from a manual task into a streamlined diagnostic process.
Session replay provides significant value when embedded into formal UX and adoption audits. Instead of reviewing sessions randomly, enterprises should integrate replay analysis into structured evaluation cycles. For instance, during quarterly audits of onboarding workflows, replay can validate whether users follow the intended paths or consistently diverge. When aligned with defined benchmarks, replay provides not only insights but also evidence for prioritizing design changes.
Operationalizing replay ensures consistency and comparability across time periods and projects. It also moves replay beyond storytelling into the realm of measurable process improvement. Teams can document recurring themes identified during audits and track whether interventions resolved them. Over time, replay analysis becomes a key input into the organization's continuous improvement framework. This systematic approach elevates replay from a reactive tool to a proactive strategy enabler.
Although Microsoft Clarity is optimized for scale, enterprises must still consider storage and performance implications. Each replay represents a detailed record of user activity, and while Clarity handles infrastructure, organizations should manage retention policies. Retaining sessions indefinitely can introduce unnecessary compliance risks and clutter insights with outdated behaviors. By defining clear retention timelines, teams ensure that only relevant and recent sessions remain accessible.
Performance considerations also extend to how replay data is accessed and used within teams. Organizations should implement internal guidelines to limit unnecessary replay reviews that do not support specific objectives. From an IT perspective, ensuring that Clarity scripts are implemented efficiently avoids any performance degradation on end-user systems. Enterprises may also integrate replay exports into secure data environments for specialized analysis. These technical precautions safeguard both user trust and organizational efficiency.
Microsoft Clarity provides three core types of heatmaps: click, scroll, and area-based heatmaps. Click heatmaps show where users focus their interactions, scroll heatmaps display how far down a page users travel, and area heatmaps highlight aggregated engagement in defined regions. Each type provides a different dimension of understanding user behavior, and together they create a holistic view of interaction patterns. Professionals need to interpret these heatmaps with technical precision, as misinterpretation can lead to wasted redesign efforts. Efficient analysis requires combining all three heatmap types to form actionable insights that can be tied back to enterprise KPIs.
Click heatmaps go far beyond identifying "popular" page elements. They can uncover design flaws, such as when static content is mistaken for interactive elements. This often occurs when buttons and images share similar styles, creating false affordances that mislead users. Advanced practitioners of Microsoft Clarity use click heatmaps to validate design decisions and identify patterns of misdirected user intent. Over time, these insights can guide redesigns that reduce friction, improve task completion, and ensure user actions align with intended outcomes.
Scroll heatmaps are critical for diagnosing engagement in long workflows, forms, or content-heavy enterprise portals. They show exactly where users stop scrolling, which often correlates with high abandonment rates. This allows teams to optimize content placement by surfacing key information above the fold and simplifying sections that discourage deeper engagement. When analyzed across multiple devices, scroll heatmaps also highlight usability differences between desktop and mobile experiences. These insights become essential for organizations managing hybrid workforces that access digital platforms across multiple devices.
Area-based heatmaps aggregate interactions within larger sections of a page, such as menus, navigation panels, or dashboards. This is particularly valuable in enterprise applications like Microsoft SharePoint, where navigation complexity often creates adoption barriers. By analyzing which areas receive the most or least attention, teams can restructure layouts to guide users more effectively toward high-value content. For intranet sites, area heatmaps can reveal whether employees actually engage with critical corporate resources. Over time, this enables enterprises to make evidence-based decisions about portal design and governance.
Heatmaps are most powerful when correlated with measurable business outcomes. For example, a heatmap that shows high engagement with secondary content might reveal misaligned design priorities if conversion rates remain low. Organizations can use Clarity's filters to segment heatmap data by user cohorts, such as new employees or external customers, and compare engagement patterns. When tied to adoption or productivity metrics, heatmap data becomes actionable rather than anecdotal. This integration ensures that heatmaps serve as tools for transformation rather than just visualization.
Microsoft Clarity includes filtering options for device type, browser, geographic location, referrer, and user interactions. These filters allow professionals to isolate specific cohorts of users for detailed analysis. Advanced users often combine multiple filters to narrow sessions to a manageable and meaningful subset. For example, isolating rage clicks on outdated browsers may reveal compatibility issues that disproportionately affect certain groups. This filtering capability is central to making Clarity efficient at scale because it prevents teams from drowning in data.
Complex segments allow analysts to uncover nuanced behavioral insights. Combining filters like device type, traffic source, and interaction events can highlight very specific problems, such as mobile users abandoning forms after repeated scrolling. These granular views are particularly important in enterprises with diverse audiences and complex workflows. For instance, internal employee interactions with a CRM tool will differ significantly from external customers navigating a support portal. By segmenting with precision, Clarity users ensure their insights are contextually accurate and operationally relevant.
Reusable filters provide efficiency by standardizing cohort definitions across teams. Analysts can save filters such as "first-time visitors," "mobile-only users," or "abandoned checkout flows" and apply them consistently across analyses. This ensures that every report uses the same definitions, which reduces confusion and enables easier benchmarking across departments. Reusable filters also accelerate analysis, as teams do not need to rebuild cohorts for each study. Over time, they form a library of segments that directly map to enterprise priorities.
The real efficiency of segmentation lies in linking it with business metrics. For instance, segmenting users by adoption stage in an ERP system and correlating their behavior with license utilization rates provides actionable insight. This allows organizations to identify which user segments struggle with adoption and design targeted interventions. Segmentation can also help highlight gaps in customer engagement that affect revenue or satisfaction. When properly aligned with KPIs, Clarity becomes not just an analytics platform but a driver of measurable business value.
Integrating Clarity with Google Analytics is often the first step toward ecosystem efficiency. Google Analytics provides traffic source and conversion data, while Clarity reveals interaction-level insights. Together, these tools provide a complete picture of user behavior from acquisition to engagement. This integration allows teams to correlate qualitative findings with quantitative performance, strengthening decision-making. For enterprises, this combination ensures that marketing and adoption teams operate on unified data.
Power BI is a natural integration point for Clarity because it transforms raw behavioral data into executive-friendly dashboards. Session replay insights can be overlaid with training completion metrics, adoption rates, or productivity measures. This makes it possible for leaders to see how user friction directly affects business outcomes. When embedded into leadership dashboards, Clarity insights become part of strategic conversations rather than isolated reports. This elevates behavior analytics from operational detail to executive-level intelligence.
Enterprises can export Clarity insights into Azure for automation and advanced analytics. Azure workflows can be configured to trigger alerts when Clarity detects critical friction patterns, such as repeated rage clicks in high-value workflows. This reduces response times by ensuring issues are flagged automatically for investigation. Data scientists can also use Azure Machine Learning to build predictive models that leverage Clarity data. This creates a proactive approach to adoption, where issues are anticipated rather than merely diagnosed.
Behavior analytics should not exist in isolation but as part of an enterprise-wide intelligence framework. Clarity data can feed into data lakes, enterprise resource planning dashboards, or AI-driven personalization engines. This alignment ensures that user behavior insights inform not only UX improvements but also strategic initiatives such as digital adoption and transformation. When behavior data is aligned with financial and operational datasets, decision-makers can prioritize interventions that maximize ROI. In this way, Clarity becomes a core building block in the enterprise analytics stack.
Enterprises rely on platforms like Microsoft 365 to enable collaboration and productivity. However, adoption of tools such as Teams, SharePoint, and OneDrive often lags without clear visibility into user behavior. Clarity helps organizations identify where employees struggle in these workflows. For instance, repeated evidence of confusion in SharePoint navigation highlights the need for clearer design or training. Over time, these insights ensure that digital workplace tools deliver their intended value.
Employee onboarding is one of the most critical adoption challenges. Session replays reveal where new employees encounter difficulties, whether in HR portals, learning management systems, or CRM platforms. Heatmaps show which training resources attract engagement and which go ignored. By addressing these gaps, organizations accelerate time-to-productivity and reduce support costs. Clarity provides not only diagnosis but also the data foundation for iterative improvements in onboarding design.
Artificial intelligence in the enterprise increasingly depends on behavioral data to deliver personalization. Clarity provides the granular inputs required to train AI models that predict adoption risks or personalize content delivery. For example, users who repeatedly abandon forms may benefit from tailored nudges or guided walkthroughs. By integrating Clarity insights into personalization engines, enterprises can deliver more relevant experiences that drive adoption. This creates a feedback loop where AI and analytics reinforce each other.
Digital transformation is a continuous process, not a one-time implementation. Clarity provides the visibility required for iterative measurement and improvement. By continuously monitoring behavior, organizations can track the impact of changes and refine their strategies. This prevents transformation efforts from stagnating after initial rollout. Over time, Clarity ensures that transformation programs remain agile, evidence-based, and outcome-driven.
Qualitative insights from replays and heatmaps are compelling but must be tied to quantitative outcomes. For instance, identifying rage clicks is valuable, but without linking them to adoption rates or revenue impact, the insight may not drive action. Professionals must always integrate qualitative data with metrics like conversion rates, task completion, or productivity scores. Without this linkage, Clarity risks being used as a curiosity rather than a strategic tool. Efficiency requires focusing on insights that connect directly to business performance.
Heatmaps and session replays can be misinterpreted if not analyzed with context. High click volumes on non-critical elements might reflect confusion rather than engagement. Similarly, high scroll depth might not indicate interest but rather difficulty finding information. Analysts should always interpret Clarity data within the context of user intent and organizational goals. Structured frameworks for interpretation prevent wasted effort on misaligned conclusions.
Improper governance of session replay data can lead to compliance risks. Although Clarity anonymizes sensitive data by default, enterprises must validate these configurations to avoid accidental exposure. Lack of clear policies on retention and access can also create vulnerabilities. Governance teams should implement access control, regular audits, and compliance reporting. By proactively addressing governance, organizations reduce risks and improve trust in Clarity insights.
One of the most common pitfalls is failing to operationalize insights. Clarity may identify friction points, but without integration into product roadmaps or adoption strategies, the insights remain unused. Efficient organizations create structured feedback loops where Clarity data directly informs decision-making. This ensures that insights translate into tangible improvements rather than reports that sit unused. Operationalization is the key to turning analytics into outcomes.
Microsoft continues to integrate Clarity more deeply into its ecosystem, with potential future connections to Dynamics 365 and Copilot tools. These integrations will make it easier for enterprises to unify behavior analytics with CRM and productivity platforms. Professionals should anticipate Clarity becoming a default analytics layer across Microsoft applications. This roadmap positions Clarity as a foundational tool in enterprise adoption strategies. Alignment with Microsoft's broader vision ensures Clarity will continue to grow in importance.
Clarity is evolving beyond descriptive analytics into predictive territory. AI-driven models will likely forecast adoption risks or highlight friction before they occur. This will allow organizations to act proactively rather than reactively. Predictive analytics could also help prioritize fixes based on potential business impact. As AI capabilities expand, Clarity’s efficiency will come from automation and foresight, not just diagnostics.
Manual tagging of events and behaviors is resource-intensive, particularly at enterprise scale. Auto-tagging features under development promise to reduce analyst workload by automatically classifying behaviors. Automation will also make insights more accessible to non-technical stakeholders. By removing manual overhead, enterprises can focus on strategic application of insights rather than technical setup. This evolution will make Clarity more efficient for organizations managing large-scale digital ecosystems.
As enterprises invest more heavily in AI-driven transformation, behavior analytics will play a central role. Clarity’s scale, cost-effectiveness, and ecosystem integration make it well-positioned for this shift. Behavioral insights provide the context AI needs to personalize, automate, and optimize user experiences. This makes Clarity a key enabler of the next wave of enterprise transformation. The ability to combine analytics, AI, and adoption strategies will define the most successful organizations.
When I look at how enterprises succeed in digital transformation, a consistent theme emerges: they combine insights with action. Microsoft Clarity offers unparalleled behavioral insights at scale, but its real value comes when organizations know how to use Microsoft Clarity efficiently as part of a broader strategy for adoption and transformation. Efficiency means implementing Clarity with governance, using session replays and heatmaps with purpose, segmenting data for actionable insights, and integrating findings into platforms that deliver in-app guidance and automation.
The future of digital adoption depends on more than deploying technology. It requires organizations to measure behavior, act on insights, and continually optimize experiences. Clarity provides the visibility, but success ultimately comes from operationalizing these insights into strategies that accelerate adoption, reduce friction, and deliver measurable results across the enterprise.

As we have highlighted throughout this article, analyzing user behavior with Microsoft Clarity is just the first step. To truly drive adoption and remove friction, organizations need the ability to act on those insights in real time. It takes contextual support, intelligent automation, and scalable guidance delivered exactly when and where users need it. This is where we believe VisualSP can help transform how your teams leverage Clarity data.
At VisualSP, we integrate directly into enterprise web applications to deliver in-the-flow, real-time support without disrupting user activity. Walkthroughs, inline help, videos, and tooltips are available right inside the platform, so employees never have to leave their tasks. This immediate, contextual guidance allows organizations to go beyond identifying adoption challenges with Clarity and instead resolve them seamlessly within the application itself.
A defining capability of our platform is our AI-powered content creation engine. With it, you can produce walkthroughs, guides, and other support materials in minutes instead of spending hours on manual documentation. This not only accelerates time to value but also ensures your help resources evolve alongside your digital environment. Paired with the insights provided by Clarity, this functionality closes the gap between detection and action, empowering teams to continuously improve user adoption.
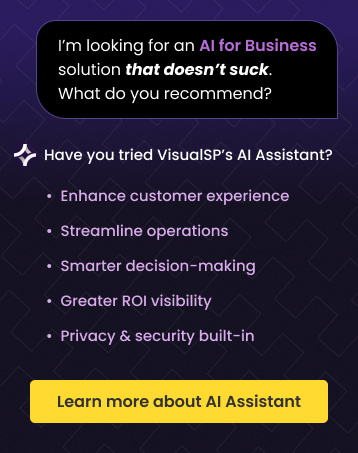
VisualSP also features an AI assistant that understands context and delivers intelligent, just-in-time guidance. Whether teams need help summarizing communications, extracting details from enterprise systems, or navigating complex workflows, our assistant ensures they get the right support at the right moment.
We have already supported over 2 million users at organizations including NHS, VHB, and Visa to improve adoption, boost productivity, and deliver measurable business outcomes. If you’re ready to move beyond observing user behavior and start addressing adoption barriers at scale, we invite you to explore how VisualSP can help turn your Microsoft Clarity insights into real impact.
Fuel Employee Success


Stop Pissing Off Your Software Users! There's a Better Way...
VisualSP makes in-app guidance simple.
