Most Copilot dashboards I see in the wild tell the same story: licenses assigned, active users counted, maybe a line chart of prompts per week trending upward. Leadership nods. The IT team breathes out. Adoption looks fine.
Then I ask the harder question: what are people actually doing inside Copilot, and what are they giving up on? The silence that follows is the entire reason this article exists.
Microsoft's native Copilot usage reports give you the headlines. They do not give you the behavior. And without behavior data, every adoption decision you make is a guess dressed up as analytics.
Active users. Prompts sent. License utilization. These are inventory metrics, not adoption metrics. They tell you whether someone opened the Copilot pane this week. They do not tell you whether the user found what they needed, abandoned the prompt mid-sentence, retyped it three times, or quietly switched back to Google after a frustrating round trip.
I have walked into organizations celebrating 80 percent Copilot license utilization where the average user sends one prompt per week, and that prompt is "summarize this email." That is not adoption. That is a very expensive autocorrect.
The gap is structural. Microsoft Clarity, the free behavioral analytics tool Microsoft built for public websites, captures the kind of granular, qualitative behavior that explains the "why" behind usage numbers. The problem is that Clarity was never designed to run inside internal Microsoft apps like the Copilot pane in Outlook, Word, Teams, or Dynamics. That is exactly the gap Clarity Connect 365 closes.

Clarity Connect 365 brings Microsoft Clarity's session recordings and heatmaps into Microsoft 365, Copilot, and Dynamics 365 environments with no custom code required. It can be deployed through either a centralized installation package or a browser extension, depending on the surface. Once it is in place, the data shifts from a license report to a behavior story.
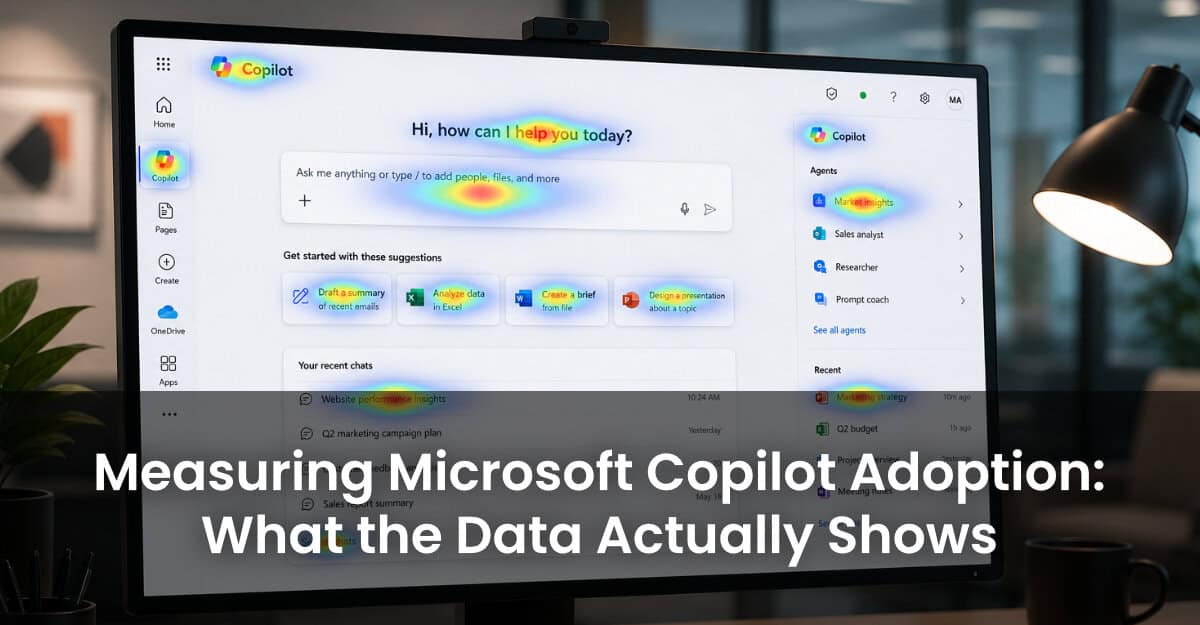
Here is what that looks like in practice. A heatmap on the Copilot pane shows you which suggested prompts get clicked and which get ignored. Session recordings show you the user who opens Copilot, types half a prompt, deletes it, types something else, gets back a result they do not like, closes the pane, and never opens it again that week. Event tracking shows you the difference between users who run two prompts and stop and users who iterate on a prompt five times until they get value.
Those are different problems with different fixes. The first is a discovery problem because your users do not know what Copilot can actually do. The second is a prompting skills gap because they know what they want but cannot get there. A native Microsoft report shows both groups as "active." Behavior data shows you the chasm between them.
Once teams start watching real sessions instead of staring at usage charts, the same three questions come up in nearly every deployment.
Where do users abandon Copilot mid-task? Session replays show you the exact point where someone gives up. Maybe it is the result quality. Maybe it is the citation panel they cannot figure out. Maybe it is the latency on a specific document type. You stop guessing and start fixing the specific moment of friction.
Which features do users actually discover? Heatmaps on the Copilot interface make this brutally clear. If 4 percent of users ever click "Generate" inside the Word Copilot pane and 91 percent only ever use the chat box, you have a UI discovery problem that no amount of training emails will solve. You change what you surface, where you surface it, or how you announce it.
Is your enablement actually changing behavior? This is the question every digital transformation leader cares about, but almost no one can answer. Pair a training rollout or in-app guidance push with behavioral analytics, and you can measure directly whether the people who got the training prompt Copilot differently afterward. If they do not, the training is theater. If they do, you have proof to scale it.
Anytime I introduce session recordings inside an enterprise Microsoft environment, the next question from IT and Security is the same: what about sensitive data? Fair question. Copilot interactions surface customer names, financial figures, internal documents, HR data, and every other category that has to stay locked down.
Clarity Connect 365 ships with enterprise-grade masking rules that organizations configure themselves. You decide which fields, regions, or content types get blurred or excluded from recordings. VisualSP does not store or replay the data. Instead, your Clarity project does under your control and with the masking rules you set. It works in both production and sandbox environments with separate Clarity projects, so you can pilot before rolling out broadly. That is why it works for environments at NHS, Hyatt, Deloitte, Lockheed Martin, and Visa, and why it is GDPR/CCPA aligned and SOC-aware.
If I had to compress the lesson from every Copilot deployment I have seen, it is this: native usage reports tell you Copilot is being touched. Behavioral data tells you whether it is being used. The gap between those two states is where every Copilot ROI argument is won or lost.
Get the behavior data in front of the people running the rollout. Stop arguing about adoption from screenshots of license utilization dashboards. Watch ten session replays, and you will know more about your Copilot deployment than the last ten status reports combined.
VisualSP accelerates digital adoption, digital transformation & user training.

Stop Pissing Off Your Software Users! There's a Better Way...
VisualSP makes in-app guidance simple.

